by R. Grothmann
>load "feigenbaum"
Try the following notebook, which produces the famous chaotic behaviour, which was investigated by Feigenbaum.
>type f
function f (x, l)
return l*x*(1-x);
endfunction
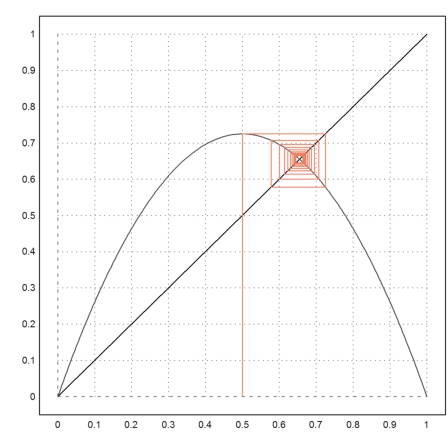
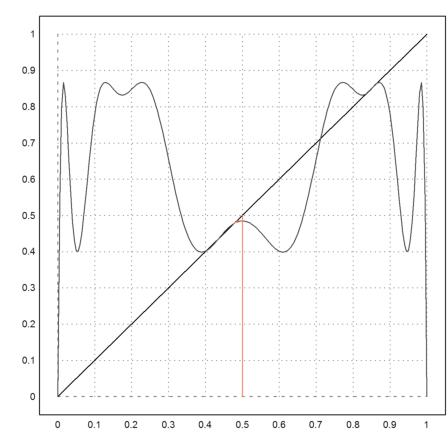
We use a so-called web plot to visualize the iteration. Follow the red line to see the iteration values.
The iteration converges well for l<3.
>l=2.9; fwebplot("f(x,l)",0,1,0.5,20):
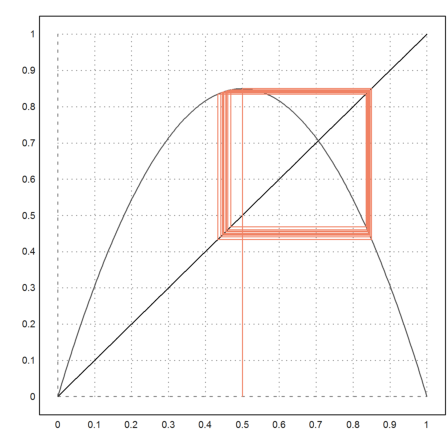
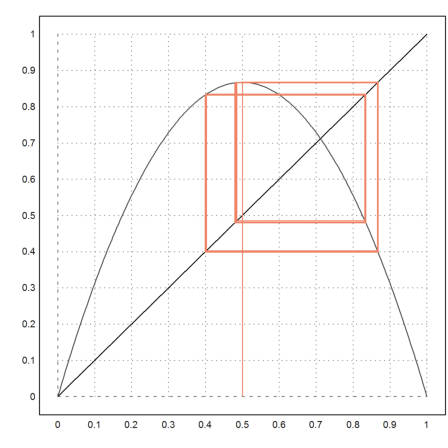
However, for l>3 it switches between two points.
>l=3.4; fwebplot("f(x,l)",0,1,0.5,20):
With the following animation, we can experience the changes in convergence, when the parameter l changes from 0 to 4. The initial value is 2.5.
Use the cursor up or down key to change l.
>animatefeig();
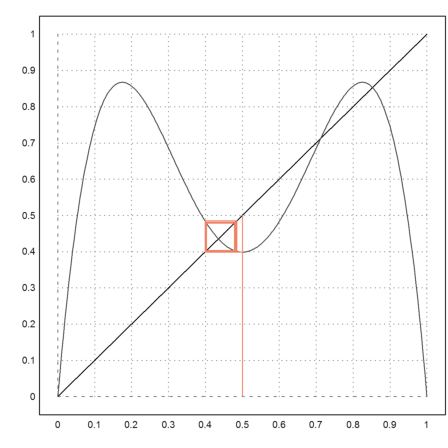
To see, what happens, we iterate f times f.
>l=3.4; fwebplot("f(f(x,l),l)",0,1,0.5,20):

For larger l, we the iteration switches again.
>l=3.47; fwebplot("f(f(x,l),l)",0,1,0.5,20):
We can investigate f(f(f(f(x)))) now.
>l=3.47; fwebplot("f(f(f(f(x,l),l),l),l)",0,1,0.5,20):
The orginal iteration exhibits 4 limit points now.
>l=3.47; fwebplot("f(x,l)",0,1,0.5,20):
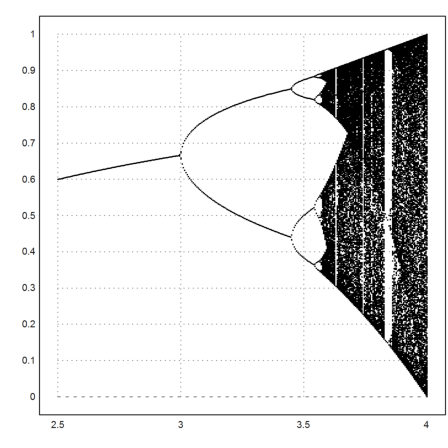
We now try to display all limit points for various l.
The function f is iterated, starting from 0.5, 1000 times, and we take the last 500 iterations.
>l=2.5:0.005:4;
>x=0.5*ones(size(l));
Note: The niterate function is given an additional argument l.
>h=niterate("f",x',1000;l'); h=h[:,500:1000];
xmark is a bit slow for that many points.
>plot2d(l,h',points=1,style="."):