by R. Grothmann
In this notebook, I want to study simple Julia sets and the Mandelbrot set.
First we start by defining an iteration procedure iter(z,c), which iterates
![]()
for some numbers in the complex plane until the maximal value of the numbers z gets very large. The function returns the values of z_n and the number of iterations.
>function iter (z,c,n=100) ...
 h=z;
 loop 1 to n;
   h=h^2-c;
   if totalmax(abs(h))>1e20 then
     m=#; break;
   endif;
   end;
 return {h,m};
 endfunction
Now we apply the iteration to numbers in [-2,2]x[-2,2] in the complex plane.
>c=0.8; ...
 x=-2:0.01:2; y=x'; z=x+I*y; ...
 {w,n}=iter(z,c);
We scale the numbers, determining the logarithmic growth of the numbers.
>wr=max(0,log(abs(w)))/2^n;
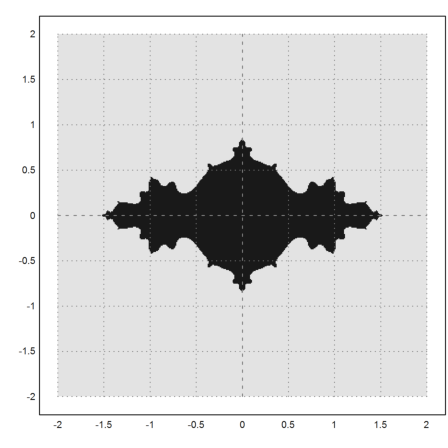
Thus we get an approximation of the logarithmic potential of the Julia set of z^2-c. This set is the set of all points, where the iteration remains bounded.
>plot3d(re(z),im(z),wr,hue=1,zoom=3.5); insimg();
Here is another plot of the same set (as accurately as our grid was).
>density(wr>0.0001); setplot(-2,2,-2,2); xplot():
Now we show the Mandelbrot set. This is the set of all c, such that the iterate z=z^2-c is bounded, when starting with z=0. I.e., the orbit of 0 is bounded.
>x=-2:0.01:3; y=(-2.5:0.01:2.5)'; z=x+I*y;
We can use the same iteration, since c is just replaced by z.
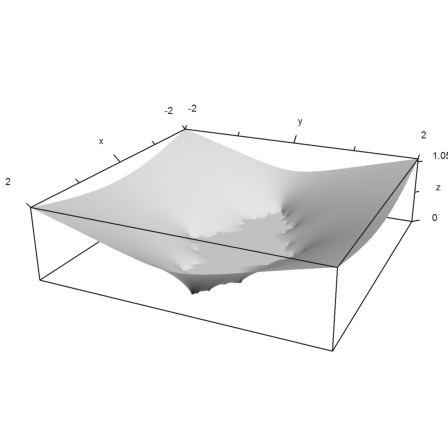
>{w,n}=iter(zeros(size(z)),z); ...
 wr=2*max(0,log(abs(w)))/2^n; ...
 plot3d(re(z),im(z),wr,>hue,light=[1,1,0],zoom=3.5,height=45°,<frame):

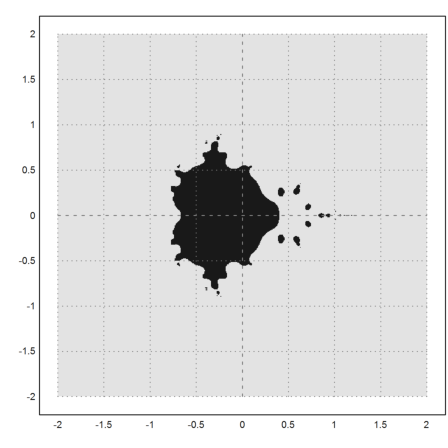
The density plot of this coarse approximation looks like this.
>density(wr>0.0001); setplot(-2,2,-2,2); xplot():
The following function iterates 100 times. The values of z larger than 100 in absolute value are set to 100 in each iteration. This is an effective way to use the Euler matrix language.
>function mandelbrot (a,b,c,d,n=500,m=100) ...
 z=linspace(a,b,n)+1i*linspace(c,d,n)'; h=zeros(size(z));
 loop 1 to m
   h=h^2-z;
   h=(abs(h)>10)*10+(abs(h)<=10)*h;
 end
 density(log(max(abs(h),1))>0.001);
 setplot(a,b,c,d);
 xplot();
 return h;
 endfunction
The following takes about 10 seconds on my computer. We iterate on the default 500x500 grid.
>mandelbrot(-0.1,1,-0.1,1):
In the following library function mandel(z), we don't iterate all values of the matrix 100 times, but each value only until it exceeds 10 in absolute value. The return value is the number of iterations it took to exceed the maximal value.
You cannot compile this on the installation directory. So we copy the file to your home directory.
>fn="mandelbrot.c"; filecopy(home()+fn,eulerhome()+fn); ...
 cd(eulerhome()); tccompile mandelbrot
Load the library function.
>dll("mandelbrot","mandel",2);
>function mandelbrot (a,b,c,d,n=500,m=100) ...
 z=linspace(a,b,n)+1i*linspace(c,d,n)';
 res=mandel(z,m);
 density(m-res/m);
 setplot(a,b,c,d);
 xplot();
 endfunction
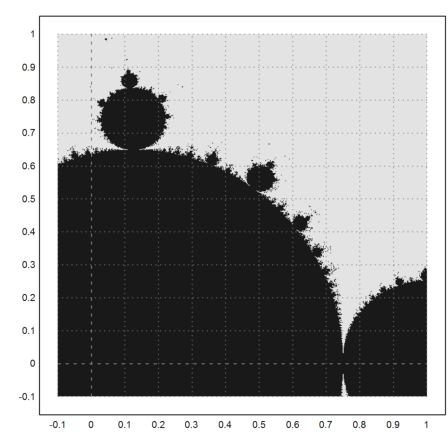
>mandelbrot(-0.1,1,-0.1,1):
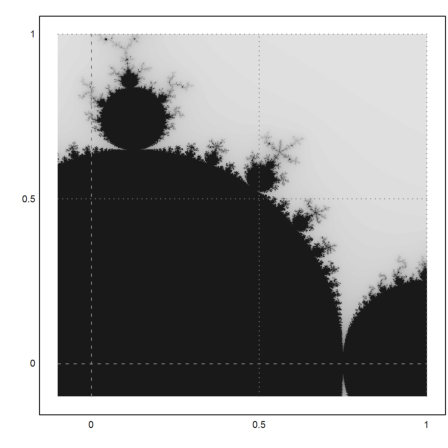
A closer look.
>mandelbrot(0.4,0.8,0.4,0.8,m=500):
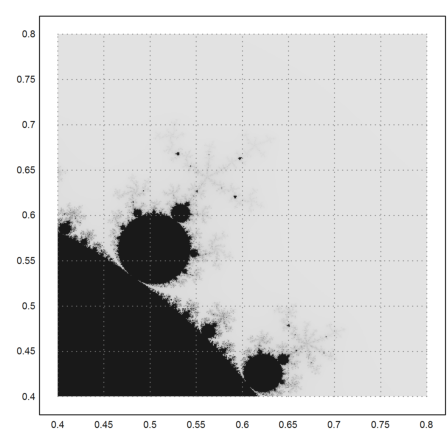
Here is a very intimate detail with more iterations for more sharpness in details.
>mandelbrot(0.746,0.75,0.072,0.076,m=1000):
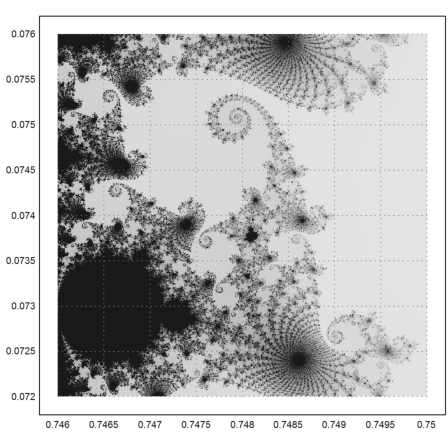
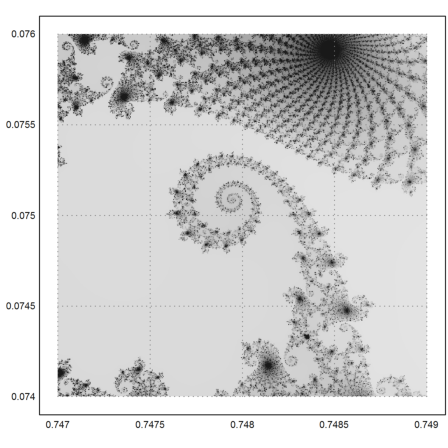
Zooming in once more.
>mandelbrot(0.747,0.749,0.074,0.076,m=1000):
Here is a more colorful version of the plot, using the plotrgb function, and some color manipulation.
>function cmandelbrot (a,b,c,d,n=500,m=100) ...
 z=linspace(a,b,n)+1i*linspace(c,d,n)';
 res=mandel(z,m);
 res=1-(res-totalmin(res))/(totalmax(res)-totalmin(res));
 res=sqrt(res);
 window(0,0,1024,1024);
 plotrgb(rgb(res*0.5,res,res));
 shrinkwindow;
 endfunction
>cmandelbrot(0.747,0.749,0.074,0.076,m=200):

The following curve builds the Mandelbrot set.
>t=linspace(0,2*pi,500); z=(exp(2*I*t)-2*exp(I*t))/4;
>plot2d(re(z),im(z),r=2):
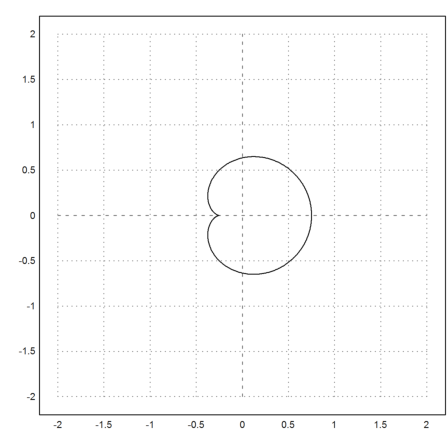
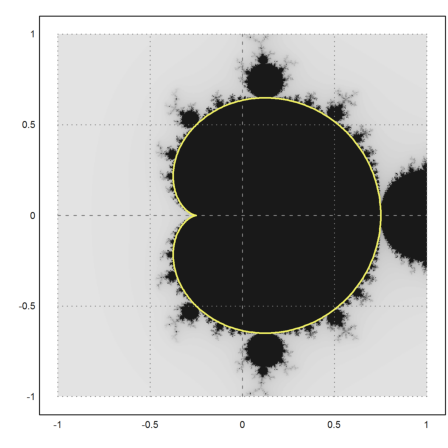
It forms the main chunk of bounded iterations. The other parts are parts, which happen to fall into this set after some iterations.
>mandelbrot(-1,1,-1,1); ...
   plot2d(re(z),im(z),r=1,add=1,thickness=2,color=yellow);  ...
   insimg;
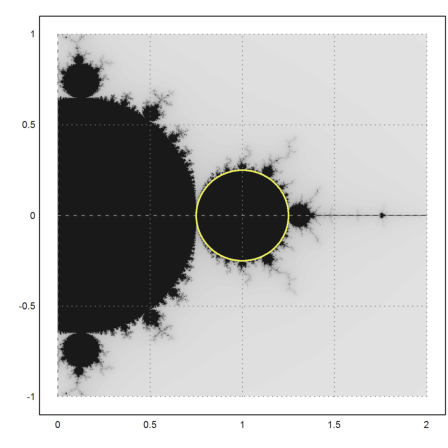
There is a second part, which is completely covered with bounded iterations.
>mandelbrot(0,2,-1,1); ...
   t=linspace(0,2*pi,500); z=1+exp(t*I)/4; ...
   plot2d(re(z),im(z),a=0,b=2,c=-1,d=1,>add,color=yellow,thickness=2);  ...
   insimg;